Driving with the rear view mirror
- Tiago Figueiredo

- May 10, 2020
- 6 min read
Updated: May 18, 2020
Markets finished higher following another remarkable week for the economy and financial markets.
Another week, another eye-popping data release.
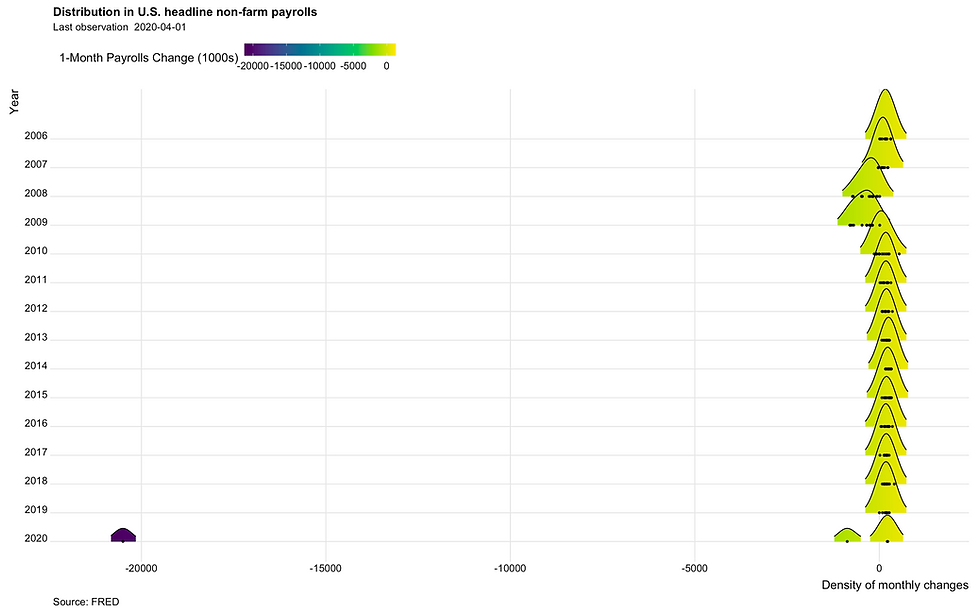
US non-farm payrolls came out on Friday, and it was a pile smouldering ashes. The chart below provides some context to the scope of the job losses, but, in reality, it's not entirely clear there's much value in sifting through the report itself. Often, we think of these data releases as mere numbers, but they aren't; these are people who have lost their jobs, and likely their health insurance, as a result of a global pandemic (I can taste the irony). The shocking part of all of this is that we probably haven't seen the worst of the numbers. The total psychological and financial burden on workers and their families when 20 million people lose their jobs in the space of a month is something we've never experienced. The silver lining, if we can call it that, is that the majority of the layoffs may very well be temporary. Again, I caution in taking that view given that the majority of employment in the US stems from small and medium-sized businesses, which are the most likely to be wiped out. You also implicitly assume that unemployed people can continue to keep their heads above water (pay rent and eat) until they get cleared to go back to work, which may not be accurate. With states beginning to reopen despite daily case curves remaining flat, a second-wave in the US is almost inevitable, baring any miraculous developments concerning testing or a vaccine.
The tail is wagging the dog again.
Short term interest rates (STIRs) in the US began to price a negative Fed Funds rate for the start of 2021. The latest move in STIRs flags a dynamic that I've touched a bit in the past regarding financial conditions. See, the problem (if that's the right word), is that, as STIR markets begin to price interest rates cuts, central banks are faced with the challenge of either delivering on policy expectations or disappointing markets and risk a tightening in financial conditions. In a perfect world, a central bank policy drives market expectations. In reality, there's a bit of a hall of mirrors effect where one feeds off of the other. In some cases, we can have situations where the market backs a central bank into a corner and almost forces them into a policy decision. Concerning negative interest rates in the US, the Fed needs to push back sooner rather than later if they plan on keeping rates above zero. The longer they wait, the greater the threat that their pushback will be interpreted as a hawkish remark that will tighten financial conditions.
The US Treasury plans to increase supply on the long-end.
US 10-year yields were higher on the weak following the announcement that the Treasury was planning on issuing more debt at the 10 and 30-year maturities. The reasons for the higher-than-expected supply are linked to considerable uncertainty regarding the timing of fiscal spending. The result will be higher 10-year interest rates and likely a steeper curve going into the summer. It's important to note that this is strictly a supply issue and not an indication of the underlying economy recovering. Even though oil prices are up around 20 percent since the start of April, inflation expectations have remained roughly unchanged over the last few weeks.
Oil gained for a second consecutive week.
There were several catalysts at play last week, not least of which came from the Saudi Kingdom, where the Saudis sought to help bolster market sentiment by raising selling prices. Some of the largest increases were in European and Mediterranean refineries, which, conveniently, are a focal point for Russian markets. It appears as though the Saudis have taken definitive actions towards working together with Russia as part of the OPEC + alliance. It was the Saudis who had slashed prices earlier this year, effectively starting a price war, when Russia opposed further production cuts. All of the above ultimately culminated in the May futures contract settling at US$ -37 and an unfortunate story of a Mississauga day trader who ended up owing Interactive Brokers US$ 9 million after buying 200 + futures contracts for what he believed was 1 cent. You can't make this stuff up. On a fundamental basis, the latest update to the Baker Hughes data shows oil & gas exploration falling to a record low, and total rig counts in the US continue to fall. That may not be "good" news for many folks, but it is generally supportive of higher oil prices going forward.
That pesky German constitutional law.
Central banks continued to deliver or promise to provide further accommodation in the coming months. In the UK, the Bank of England (BoE) left interest rates unchanged but showed a desire to increase asset purchases later in the year. The BoE's current asset purchase program will run dry in a few months, having purchased around 200 billion pounds, and will need to be topped up. Estimates show that UK growth is projected to collapse around 30 percent in Q2, more or less in line with growth estimates in other countries. In Norway, the Norges bank lower interest rates to zero in what is being described as a "shock" move. Norway is similar to Canada in that its economy is closely tied with oil and is experiencing a double whammy if you will from a fall in oil prices and COVID-19. The European Central Bank (ECB) is also facing its own obstacles with its latest asset purchases programs. Although the German Constitutional Court decided to partially endorse the ECB's Public Sector Purchase Program (PSPP), the court has asked the ECB to provide evidence of the effects of the policy. Realistically, that shouldn't be an issue for the ECB to justify. However, it can potentially create further hurdles for future asset purchase programs.
Markets will continue to shrug off incoming data.
Markets continue to perplex investors.
Financial twitter (FinTwit) is littered with both retail and professional investors bewildered by the resilience of the rebound in equities proclaiming that it isn't "right," and asset prices "should" be struggling to stay afloat. Although I agree with that in principle, there's simply more going on. For starters, most equity analysts are looking through any bad earnings announcements on the hopes that the economy will be back and running. The massive monetary and fiscal response from policymakers in combination with a flattening of the COVID curve has provided enough of a cushion for economies to reopen slowly. Whether you think that's sustainable is another story. The point is, the reason markets are 30 percent off of their march lows is because everyone thought the world was going to end, and it didn't, and there are signs of stabilization. Anyone looking for a market reaction to weak economic data in the next few weeks is going to be disappointed. The data coming in is stale and is mostly a look in the rearview mirror. We all know things are bad out there. People are skateboarding down the Gardiner Expressway in Toronto, and the use of the unprecedented is at "unprecedented" levels.

Volatility continues to normalize.
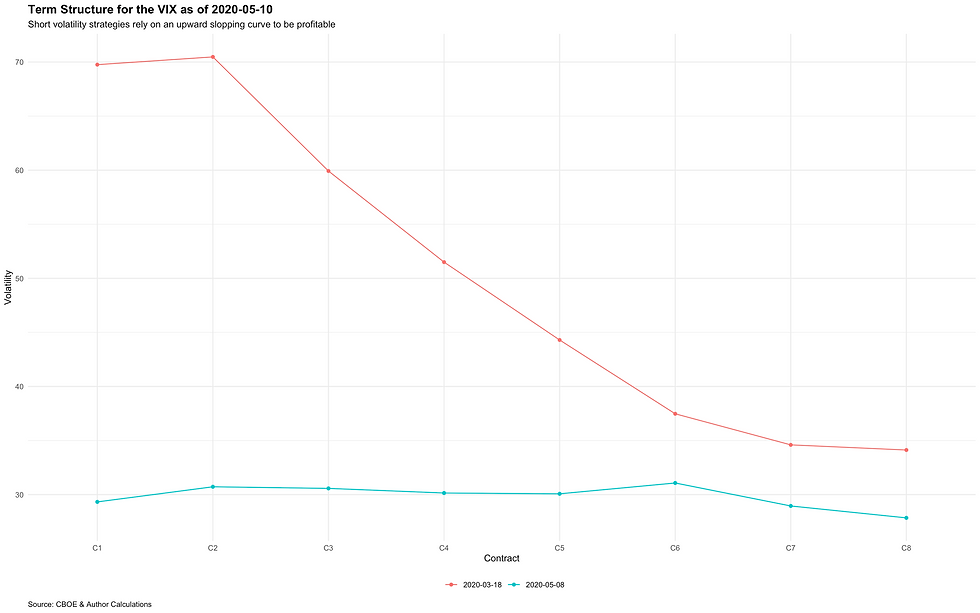
As a result of all the above, volatility markets are entering into the "all-clear" mode (kind of). After what was a pure bloodbath for short-volatility funds, we're finally starting to see the front-end of the VIX term structure go back to a "normal" upward sloping pattern. That means that we may see a resumption of these short-volatility strategies going into next week. Meanwhile, CTAs (trend-following hedge funds) were net buyers going into the end of the week, and volatility control funds are continuing to increase exposure on shorter lookback windows. For the longer lookback windows to begin to ramp up exposure, we would need to see realized volatility in the 3-month window fall below 40 (currently sitting around 60). The chart below shows the term structure of implied volatility relative to its peak in March.
Market makers are net long-gamma going into next week.
I refer to this market maker model a lot in my posts, and I'm going to take some time to add some colour to it. At the heart of this model is the idea that market makers (aka dealers) run a delta neutral portfolio and have to continuously hedge and re-hedge their positions to limit risk and realize profits from commissions and other fees. The direction in which they hedge is largely a function of the inventory that they are holding. The basic assumption is that dealers buy all call options in the market, and sell all put options. The model looks at all the open interest on options for the S&P500 and SPY and estimates the amount that needs to be re-hedged at each level of the S&P500. A positive number means that dealers are hedging against the market (buying when the market falls / selling when the market rises). A negative number means that dealers are hedging with the market (buying when the market rises / selling when the market falls). This dynamic is crucial for understanding the massive 10 percent swings we saw back in March. I was joking to a friend awhile back that it's not as if one day stock traders are ready to jump off a bridge and the next they are buying stock hand over first; these dynamics a fundamental part of the ebb and flow of markets. With that in mind, going into next week, we have dealers positioned to reduce volatility as they have positive gamma. Notably, there are two massive strikes around Friday's close, which will likely pin markets around the current spot.

Tiago Figueiredo


Comments